Tutorial 1: 10x Visium (DLPFC dataset)
##
import warnings
warnings.filterwarnings("ignore")
import logging
import scanpy as sc
import torch
import argparse
import GSG
import matplotlib.pyplot as plt
import os
import pandas as pd
args = GSG.build_args()
args
result:
Namespace(activation='elu', alpha_l=4, attn_drop=0.1, batch_size=32, cluster_label='', concat_hidden=False, decoder='gin', deg4feat=False, device=-1, drop_edge_rate=0.0, encoder='gin', feature_dim_method='PCA', folder_name='data/10X/', in_drop=0.2, linear_prob=True, load_model=False, logging=False, loss_fn='sce', lr=0.001, lr_f=0.01, mask_rate=0.8, max_epoch=500, max_epoch_f=300, negative_slope=0.2, norm='batchnorm', num_classes=7, num_features=600, num_heads=4, num_hidden=128, num_layers=3, num_out_heads=1, optimizer='adam', pooling='mean', replace_rate=0.05, residual=False, sample_name='151673', save_model=False, scheduler=True, seeds=[0], threshold_radius=25, use_cfg=False, warmup_steps=-1, weight_decay=0.0002, weight_decay_f=0.0001)The parameters can be modified in args.For example, you can use your data floder by args.folder_name = "your dataset folder".
# make new folder
result_file = args.folder_name  +  args.sample_name
GSG.mkdir(result_file)
adata = GSG.read_10X_Visium_with_label(result_file)
if(args.cluster_label == ""):
    num_classes = args.num_classes
else:
    num_classes = adata.obs[args.cluster_label].nunique()
# graph construction
adata,graph = GSG.Graph_Construction(adata,args)
# train model and embedding in adata.obsm["GSG_embedding"]
adata,model = GSG.GSG_train(adata,graph,args)
# kmeans cluster and result of clusters saved in adata.obs["GSG_Kmeans_cluster"]
adata.obs["GSG_Kmeans_cluster"] = GSG.KMeans_use(adata.obsm["GSG_embedding"],num_classes)
adata.obs["GSG_Kmeans_cluster_str"] = adata.obs["GSG_Kmeans_cluster"].astype(str)
# UMAP
sc.pp.neighbors(adata, n_neighbors=10,use_rep='GSG_embedding')
sc.tl.umap(adata)
fig_new = sc.pl.umap(adata, color="GSG_Kmeans_cluster_str",title ="GSG_Cluster_UMAP",size = 50,return_fig=True)
fig_new.savefig(result_file + "/GSG_Cluster_UMAP.pdf",bbox_inches='tight',dpi =1000)
# spatial picture
adata = GSG.GSG_Spatial_Pic(adata,args, result_file, is_show = False, is_save = True, spatial_figname = "/GSG_Cluster_Spatial.pdf", ground_truth_figname = "/Ground_true.pdf")

# trajectory show
if(args.cluster_label != ""):
    used_adata = adata[adata.obs[args.cluster_label]!= "None",]
    sc.tl.paga(used_adata, groups=args.cluster_label)
else:
    used_adata = adata
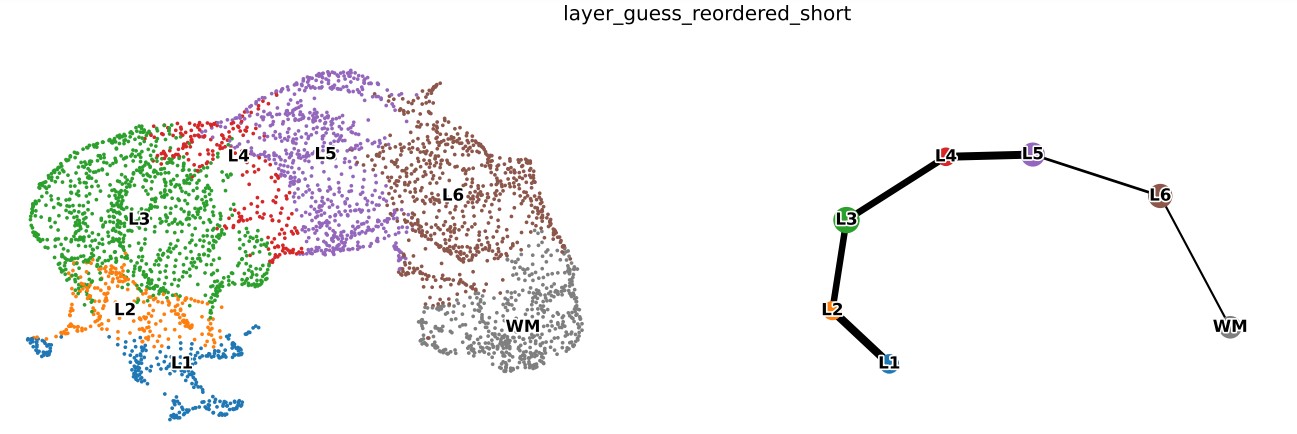
    sc.tl.paga(used_adata, groups="GSG_Kmeans_cluster_str")
sc.pl.paga_compare(used_adata, legend_fontsize=15, node_size_scale= 4, frameon=False, size=50,max_edge_width = 10,right_margin=0.2,
                    legend_fontoutline=5,title="PAGA_SHOW", show=False)
plt.savefig( result_file + "/GSG_Cluster_Embedding_PAGA_test.pdf",bbox_inches='tight',dpi =1000)

# gene reconstruct show
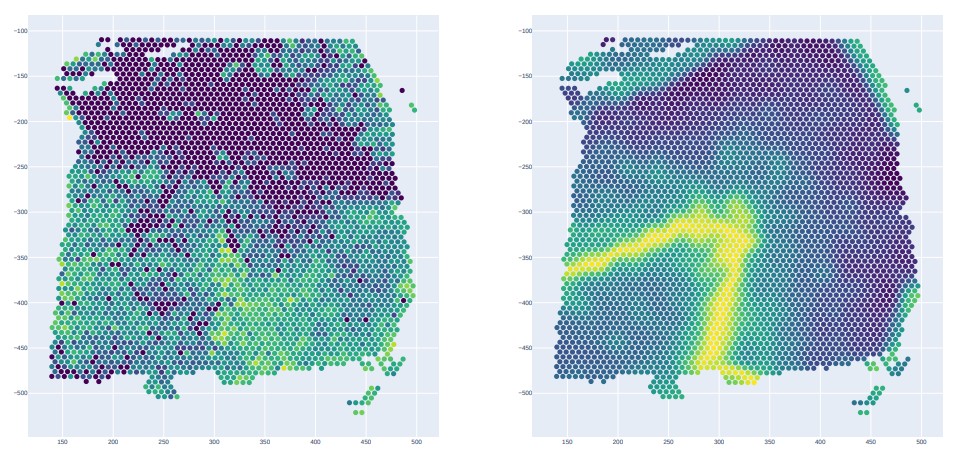
if args.feature_dim_method == "HVG":
    GSG.GSG_plot_imputation_gene(used_adata,args,result_file)
